A Brief History of Economic Cycles
A Brief History of Economic Cycles is needed to see how things evolve. Between the end of World War II (WWII) in 1945 and 2009, the National Bureau of Economic Research (NBER) recorded a total of 11 economic cycles. The general perception of an economic cycle or recession is two or more consecutive quarters of negative growth in the Gross Domestic Product (GDP). The NBER does not define a recession in terms of two consecutive quarters of decline in real GDP, but rather, a significant decline in economic activity spread across the economy, lasts more than a few months, and is normally visible in real GDP, real income, employment, industrial production, and wholesale-retail sales1.
The NBER measures the duration of these contraction cycles (recessions) along with the time between each cycle (expansion). Since WWII, the average duration of a recessionary period is 11.1 months. The most recent recession, also referred to as the Great Recession, was also the longest post-war recessionary period lasting 18 months.
In this post, we will consider the historical relationship between loan growth at Federal Deposit Insurance Corporation (FDIC) banks and savings institutions and the growth rate of the economy as measured by GDP. A Brief History of Economic Cycles can be seen below.
The Great Recession began in December 2007 and concluded in June 2009. Since then, the economy has generally been in a modest growth mode with average GDP growth of approximately 2.1%. More recently, initial GDP estimate for the fourth quarter of 2016 was 1.9%, down from 3.5% in the third quarter2. This pace of expansion continues to reflect modest expansion in the domestic economy. The NBER records the average length of a recovery to be 58.4 months, post-WWII. We are now in the 87th month of expansion since the Great Recession. This current period is also the 4th longest expansionary period since WWII. The longest expansion period took place between March 1991 to March 2001 covering 120 months.
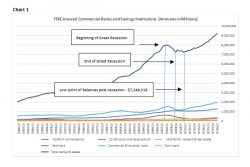
Loan portfolios continued to contract while the economy began to recover. The first eight quarters during the recovery after the Great Recession included negative loan growth, with the pace of contraction slowing with each quarter. Total loan balances continued to shrink by 4.93% from the end of the second quarter of 2009 to the first quarter of 2011 (Chart 1).
Since the end of the Great Recession in 2009, loan growth at all commercial banks has averaged a mere 3.00% Compound Annual Growth Rate (CAGR) compared to 4.88% since 1984 (Chart 2). The below-average growth during this period is largely attributed to the eight quarters following the end of the recession.
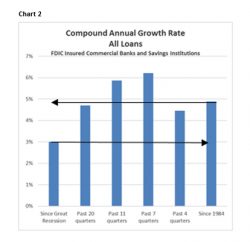
When the first eight quarters immediately following the Great Recession are removed, loan growth reflects a more robust picture. Between Q3 of 2011 through Q3 of 2016 (20 quarters), all commercial banks experienced average loan growth of 4.7% CAGR. More recently, over the 12 months ending September 30, 2016, overall loan growth rate tapered to an average of 4.45% CAGR, below the CAGR for all loans since 1984 of 4.88%.
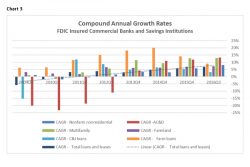
Chart 3 above clearly identifies the prolonged contraction in the Acquisition, Construction and Development (AC&D) segment. The graph also shows AC&D lending to be the only category to be consistently above 10% CAGR for each of the prior three years. In fact, in Q3 2016, AC&D led the group by quarterly growth of 3.02% and CAGR of 13.21% for 2016. Over the past 3.5 years, this category has seen 50% growth. Although this category is leading by percentage in growth, the total portfolio of $303 billion is still less than half of the all-time high of $631 billion, which was achieved in Q1 2008.
Multifamily residential has also demonstrated strong performance among the group. The prior five quarters ending September 30, 2016 experienced 10% or more CAGR. This category has seen six of the prior nine quarters greater than 10% growth. This category is second to the AC&D category by quarterly growth of 2.48% and CAGR of 12.98% for 2016.
The growth in farm lending has slowed. All-time-high commodity prices have receded and farmers are faced with some economic challenges.
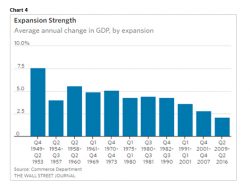
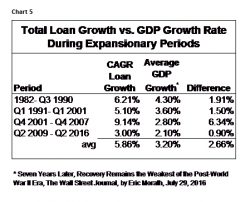
In Chart 4 below, Average annual change in GDP, by expansionary periods3, reflects the periods from 1949 through the present. The average GDP growth rate was 3.20% for the four most current expansionary periods. In comparison, the loan growth for all loans for the expansionary periods from Q1 1984 through Q3 2016 averaged 5.86% CAGR. Loan growth exceeded growth in GDP by 2.66% for those periods.
GDP average growth for the current cycle is 2.10% compared to average loan growth of 3.00% CAGR, or .90% faster than average GDP growth. Loan growth for the 92 months preceding the Great Recession for all loans was 9.14% CAGR compared to average GDP growth for the period of 2.8%, or 6.34% faster than the economy. Chart 5 compares the CAGR Loan Growth the Average GDP Growth during expansionary periods. Clearly the period from Q4 2001-Q4 2007 represented a CAGR Loan Growth to Average GDP growth well above the loan growth to GDP ratio for the two prior expansionary periods.
AC&D at 19.50% CAGR and nonfarm nonresidential real estate at 9.53% CAGR with outstanding balances representing 20% of total loan balances were significant contributors to the extraordinary loan growth during this period. Multi-family and Farmland loan growth was not far behind with CAGR of 8.57% and 8.66%, respectively. AC&D CAGR loan growth for the first three quarters of 2016 again led all growth rates at 6.40%. The Multifamily segment was the second fastest growing segment for this period at 6.29% with Farm loans in third place at 4.46% CAGR. Total loan growth was 3.29% CAGR for this period.
Not surprisingly, the average of the CAGR loan growth of 5.86% (Chart 5) for the expansionary periods is 98 basis points greater than the CAGR loan growth of 4.88% (Chart 2) since 1984, encompassing three recessionary periods. The cycles during this period reduced loan growth by 20% for all loans.
A historical look at FDIC insured commercial and savings banks’ loan balances as a total portfolio along with key components of the portfolio provides perspective considering the current economy. The growth rate of total loans and leases may serve as a barometer into the overall strength and vigor of the economy. During this period of prolonged economic expansion, overall loan growth has settled into a level that would likely continue to support growth, based on historical levels. Pent-up demand from the Great Recession was satisfied in prior quarters with a period of higher loan growth rates that have fallen back in recent periods.
The discussion continues regarding the viability and risk associated with certain segments of loan portfolios and specific industries such as oil and gas. These discussions may be regionalized based upon the various factors in specific markets as well as the strength and experience of bank risk management practices. Generally, the current growth rate of the total FDIC portfolio along with the significant components included in this paper may reflect a sustainable level for the near future. What would you add to the A Brief History of Economic Cycles?
———————–
1. Public Information Office, National Bureau of Economic Research, Inc.
2. Bureau of Economic Analysis, U.S. Department of Commerce
3. Seven Years Later, Recovery Remains the Weakest of the Post-World War II Era, The Wall Street Journal, by Eric Morath, July 29, 2016
Enlighten Financial is a specialized consulting firm that focuses on loan review and risk management services to community banks and credit unions. Enlighten Financial has made it our business to shed light on the complex financial landscape, and lead clients in the right direction. We work with financial institutions and other providers to mitigate risk. To talk to us directly, please call: (920) 445-8881.
Tags: A Brief History of Economic Cycles
Comments are closed here.